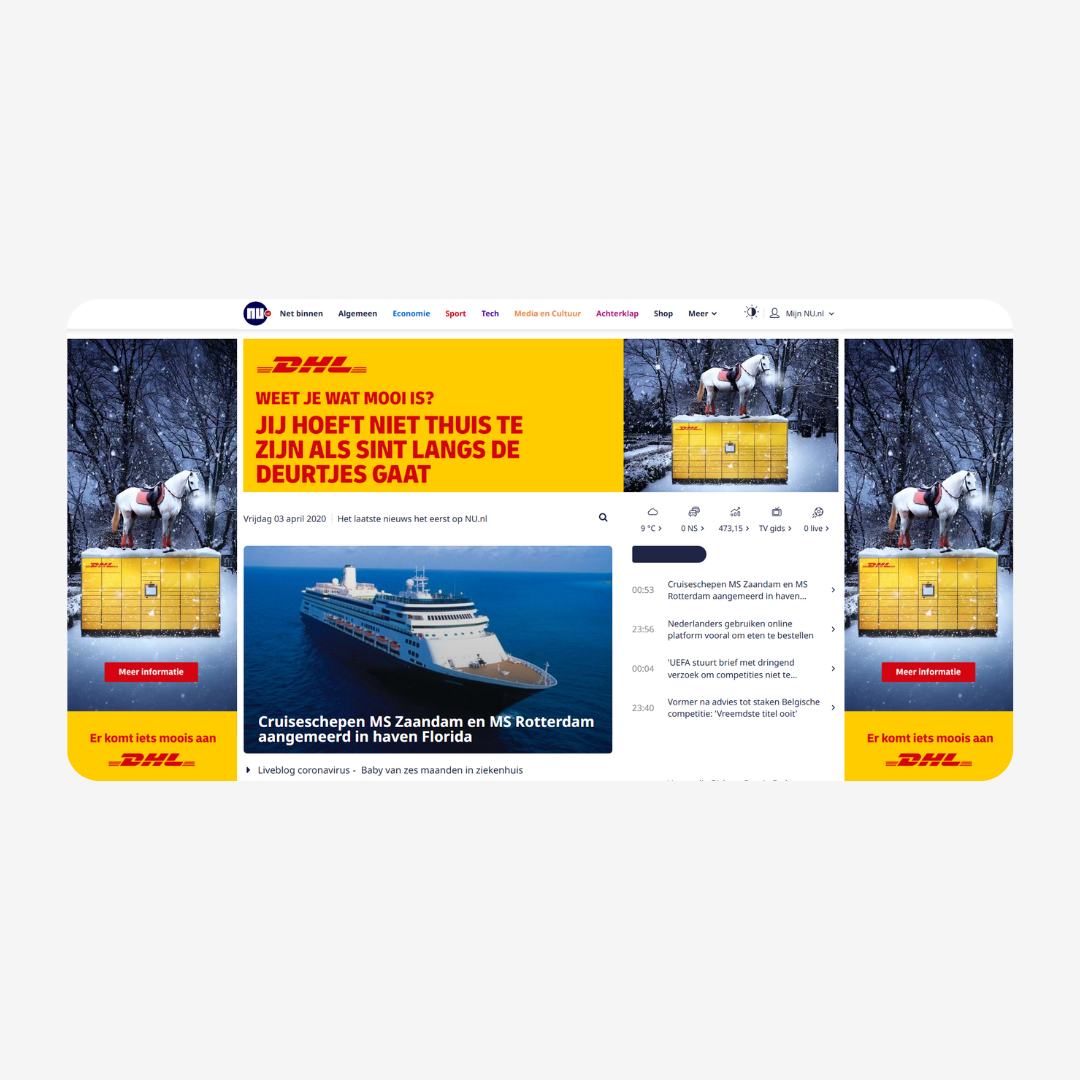
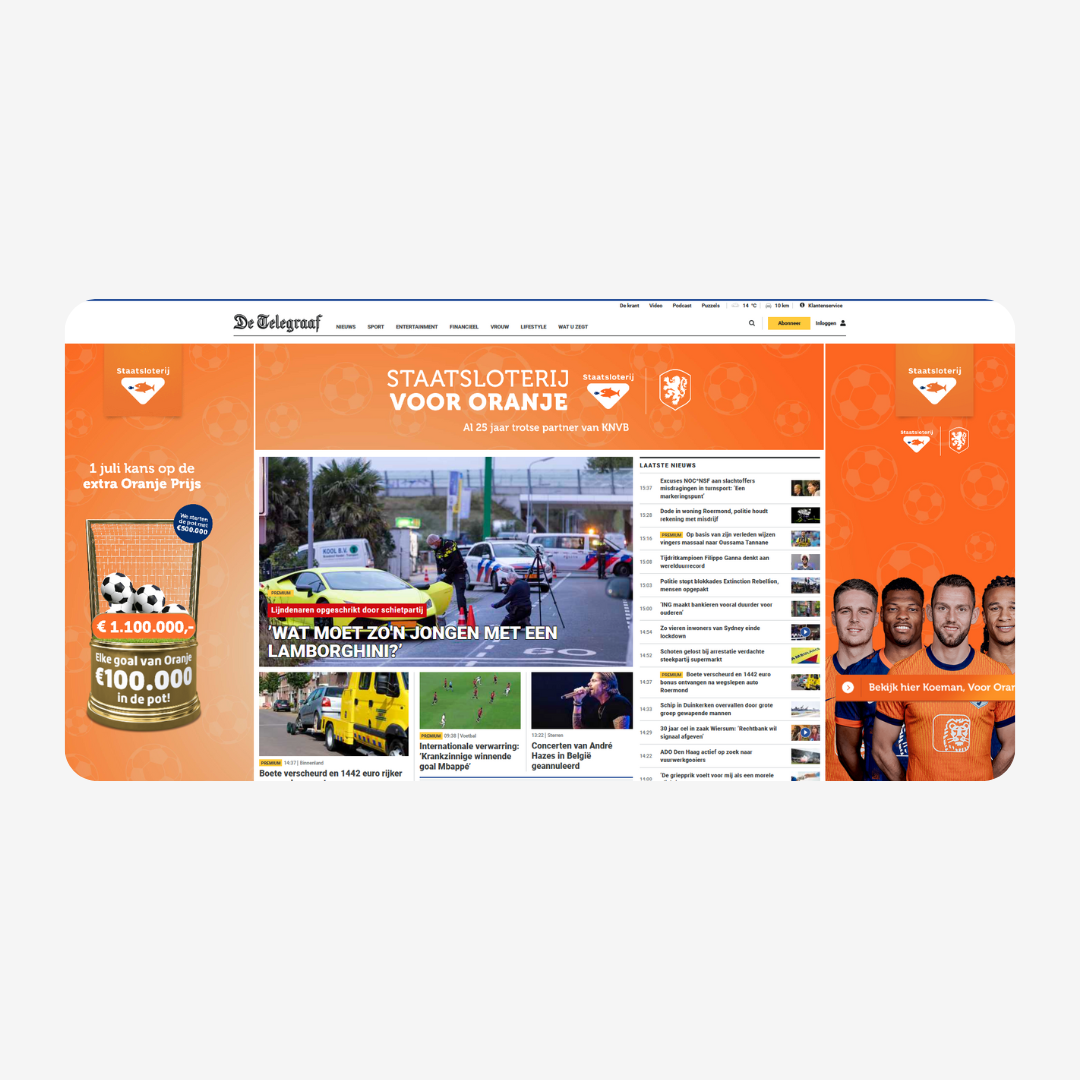
Day in, day out we are working on Rich Media campaigns for all types of advertisers. They all have one thing in common: they run on our Impact Rich Media templates to reach your target audience correctly.
Where the world wide web already is the default hangout for your audience (80% of Europeans are online and growing 6% YoY) for an advertiser it’s the most obvious place to be present.
More importantly, advertisers seek to know what advertising format will have the strongest effect on their target audience. With an ad spend of +9% in 2017, this comes to €1.832 million euro in The Netherlands alone, it’s wise to use budgets on the right formats to stand out from the competition.
Based on the data report of all our campaigns in Q3 (july-sep18), we will discuss the benchmarks of the formats we see most. Because of the data based on hundreds of campaigns these rates are a realistic representation of the formats performance but it’s still important to keep your goals (awareness, branding, leads, sales) in mind.
In this table we measured four metrics. First, CTR (Click Through Rate) is the ratio of users who click on a banner. The Engagement Rate stands for all user intended click interactions such as clicks, toggles or vide controls. All user intended click interactions including mouse overs are measured in the User Interaction Rate. Last, viewability is the rate when a user sees more than 50% of the creative for more than one second according to MRC standards.
| Type of Rich Media | CTR | Engagement Rate | User Interaction Rate | Visibility |
|---|---|---|---|---|
| APTO (Automated Page TakeOver) | 0.62% | 2.84% | 22.20% | 73.07% |
| Interscroller | 0.54% | 0.97% | 1.52% | 56.04% |
| Billboard | 0.47% | 2.90% | 8.72% | 71.33% |
| Floorad | 0.56% | 0.17% | 24.28% | 88.74% |
| 300/320x250 MWeb | 0.21% | 6.71% | 6.98% | 68.19% |
| 320x50/100 MWeb | 0.22% | 0.01% | 0.53% | 63.63% |
| Superheader | 0.31% | 1.58% | 4.94% | 50.57% |
| OVX (Outstream Video Experience) | 0.61% | 0.02% | 8.40% | 89.60% |
Metrics
APTO (Automated Page Takeover)
Once again, the APTO and Floorad score best in this overview of benchmarks. First the APTO, this format has the highest CTR. In the largest of all formats, the billboard header and skins, there is lots of space for video, buttons or lightbox call to actions to trigger interaction. Dwell time is guaranteed so combined with a high interaction potential makes the user Interaction rate of the APTO also the highest.
FloorAd
Unfortunately we see less classic Floorads nowadays because this format is considered slightly disruptive. However in some markets it remains popular. The visibility is high because the banner appears on top of the website in the bottom of the browser. The Superheader format is considered the heir sequal to the floorad in terms of size and level of creativity,
Superheader
The Superheader is a cross-device format that launched in 2017 and is also available programmatic through Impact. It is not that known by a lot of people but it certainly is a beautiful format that deserves more attention. The Superheader shows good results in this benchmark review with an engagement rate of 1,58%. There is lots of space for creativity in 100% screenwidth especially now screensizes are getting bigger over time.
Interscroller
The interscroller is possible for desktop and mobile but mostly are made for mobile web (90%). A new version of the interscroller, the midscroller, is especially for mobile publishers that are looking for a less intrusive experience. The engagement and user interaction rate doesn’t stand out but the visibility is high. These rates can be explained by the fact that most interscrollers show a lot of information already (mostly videos are added), so viewers don’t need to click through to get the information they want. On mobile there are no mouseovers so the format is all about visibility.
Billboard
The Billboard is a format that remains very conssistant and ensures good results. In this format we see a lot of different possibilities such as expands to a double billboard (970x500) and use of video(s).
Video
That video is becoming bigger and bigger is a fact. In 2019, Cisco estimates that video will take 80% of total internet traffic. We can see this in de stats of the OVX (Outstream Video Experience). Because both the visibility and CTR are very high. This is even higher than the APTO/Floorad while it has been producing the best results for some time.
Mobile
The mobile format we see most is the medium rectangle (300x250). This format has the best engagement rate of all formats. This is not strange because we spend 52% of WEB traffic on mobile (We Are Social, 2018). Furthermore, mobile formats are useable for a lot of features for example click to SMS or navigate, shake to open and 3D options. These features creates an engagement or interaction with a brand.
Compared to the last benchmark report we published there has been shifting in the data. Almost every format has better results comparing to the last benchmark report. We see an uplift in video, mobile and big rich media formats like the APTO.
Do you want to know more about these data or our templates? Get some inspiration at our showcase or get in touch with us if you have any questions. Are you in Amsterdam? We are located in the centre so drop by any time for a good talk and a nice cup of coffee.
https://www.slideshare.net/wearesocial/digital-in-2018-global-overview-86860338
https://www.iab.nl/images/downloads/Report-on-2017-Digital-Ad-spend-IAB-Nederland-Deloite-def.pdf


